- Trendpot is a backward looking measure that helps explain and understand the performance of medium to long term trend following systems.
- Trendpot can explain profits. It can also explain a lack of profits. But it is not defined to explain losses.
- Trendpot is a measure, not a trend indicator. It does not have predictive value.
In this research paper we introduce a backward looking measure – trendpot – that indicates whether a medium to long term trend following system could potentially have been profitable during the preceding month. The purpose of this measure is to help explain and understand the performance (or the lack thereof) of our Diversified Trend Program (DTP).
Trendpot
...is a number between 0 and 1:
- "0" indicates a very low chance for a medium to long term trend following system to have been profitable;
- "1" indicates a very high chance for a medium to long term trend following system to have been profitable.
The measure does not show the direction (long or short) of the potentially profitable trend.
The measure is fully transparent and is not based on any indicator used by Transtrend in its trading rules. Therefore, it is an unbiased, objective measure.
The purpose of this measure is to help explain and understand the performance (or the lack thereof) of DTP. Although the measure can provide useful insights for individual markets, its real strength lies in explaining the performance for groups of markets and the portfolio as a whole.
Data used
A characteristic of futures markets is that trading is done in different delivery months. As each delivery month will at some point expire, and there can be multiple actively traded delivery months at any one time, there is not one price series but a number of overlapping different price series. Since we are interested in one measure for every market, the price moves in these different delivery months are combined, such that only tradable active months are taken into account, giving a higher weight to the more liquid months. This way we create one continuous, potentially tradable, price series for every market.
As we are interested in the potential profitability for medium to long term trend following systems – not for short term or intra-day systems – we only take the daily closing prices into account, disregarding intraday price ranges.
If a market has declined for two consecutive months and then rises during the third month, one should not expect a medium to long term trend following system to be profitable in this last month. Therefore, as we are interested in the potential profitability in the last month, we take the price moves of the past three months into account.
As we are interested in the potential profitability for medium to long term trend following systems, we only take the daily closing prices into account.
To make the measure intuitively understandable and robust, we reduce the price data of these last three calendar months to 9 data points. For each calendar month m, we determine the highest closing price Hm, the lowest closing price Lm, and the closing price on the last trading day of that calendar month, Cm.
Therefore, trendpot for month m will be defined as a function of Hm-2, Lm-2, Cm-2, Hm-1, Lm-1, Cm-1, Hm, Lm and Cm.
Definition
If last month's close of the market is higher than the closing price of the preceding month, we want our trendpot to measure the potential profitability of a possible uptrend. We define trendpot in the following manner:
Trendpot definition
If Cm > Cm-1 then:
- newhigh = Hm – max(Hm-1, Hm-2)
- highend = Cm – Hm-1
- upmove = min(newhigh, highend)
- smoothup = min(Hm – Hm-1, Lm – Lm-1, Cm – Cm-1)
- trendup = max(0, mean(upmove, smoothup))
- decline = max(Hm-2 – Lm, Hm-2 – Lm-1, Hm-1 – Lm, Hm – Cm)
- scale = max(decline, trendup)
- trendpot = trendup / scale
The rationale behind this measurement can be explained as follows:
newhigh
If last month's high is not higher than the high of the previous two months, we can not speak of a significant upmove. There might even have been a downtrend during the previous two months; the last month being a trend reversal.
highend
If the market sets a new high during the last month (as measured by newhigh), but did not close on its high, the decline from high to close may have resulted in a costly give-in. That is why we look at Cm. Also, if previous month's close was much lower than the previous month's high, the decline from previous month's high to previous month's close might have caused a trend following system to be short, or at least not long, by the start of last month, making the chance of profiting from last month's upmove low. That is why we compare Cm with Hm-1 instead of with Cm-1. Highend defined in this way is a combination of a good probability to be long and a good probability for a small give-in.
upmove
Since we regard newhigh and highend both as necessary conditions for a medium to long term trend following system to be profitable, we define upmove as the minimum of both.
smoothup
An upmove is a necessary but not a sufficient condition for defining an uptrend. The upmove needs some ‘smoothness’. Suppose the market traded and closed high last month, but intramonth it traded extremely low – maybe even lower than previous month's low. In this case, one can not expect from a medium to long term trend following system to have maintained a long position and, by doing so, having (fully) profited from the ultimate upmove. If a market moves upward in a straight line, the high-high, low-low and close-close would all result in the same slope. By taking the minimum of the three measured slopes, we measure the smoothness of the upmove.
trendup
We simply take the mean of upmove and smoothup, but do not allow this to get below zero.
decline
To measure the significance of the uptrend, we compare it with the maximum decline at any time during the last three months. The four elements of this function contain a high and a subsequent low (or later close), thereby measuring – when larger than zero – large declines in this period.
scale
Since we require our measure trendpot not to be higher than 1, the denominator has to be at least as large as the numerator (=trendup).
As we require the trend following systems to be completely symmetric, without any long or short bias, the definition of trendpot in the case of a declining monthly close is determined by:
Trendpot definition
If Cm < Cm-1 then:
- newlow = min(Lm-1, Lm-2) – Lm
- lowend = Lm-1 – Cm
- downmove = min(newlow, lowend)
- smoothdown = min(Hm-1 – Hm, Lm-1 – Lm, Cm-1 – Cm)
- trenddown = max(0, mean(downmove, smoothdown))
- rise = max(Hm – Lm-2, Hm-1 – Lm-2, Hm – Lm-1, Cm – Lm)
- scale = max(rise, trenddown)
- trendpot = trenddown / scale
And to complete the definition:
Trendpot definition
If Cm = Cm-1 then:
- trendpot = 0
Examples
The following two graphs show the daily prices (continuation as described above) for the US 5-year interest swap and the FTSE 100 from 1 January 2009 to 31 December 2009 and the value of trendpot for every month, based on the price move of that month and the two preceding months.
Graph 1 – US 5-year Interest Swap
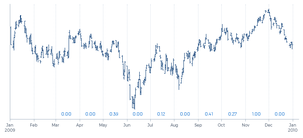
In the graphs we see for trendpot the maximum value 1 for the Interest Swap in November '09 and for the FTSE in May '09 and September '09. It may be clear from the price charts that it should not be hard for a medium to long term trend following system to be profitable in these markets in these months. The same holds for the FTSE in August '09, showing trendpot=0.88.
Notorious loss-creators for trend following systems are sharp trend reversals. In these graphs we see such reversals in June '09 and December '09 in the Swap Notes and in March '09 in the FTSE. These are recognized as being hard-to-be-profitable by trendpot=0.
Graph 2 – FTSE 100
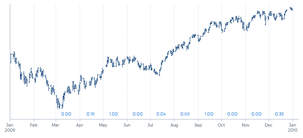
If a market moves from an extreme low price to an extreme high price within one month – as was the case in the Interest Swap in August '09 and in the FTSE in July '09 – it is also hard for a medium to long-term trend following system to be profitable. It could profit from the last part of the rise, but it probably would not profit from the first part of the rise, as it is not supposed to be long. Or even worse, it is losing in a short position.
It may be clear from the two graphs that all other months showing a trendpot at or close to zero are not very favorable for medium to long term trend following systems either. However, they do not necessarily have to result in a (large) loss.
(No) Profit versus Loss
As explained, trendpot indicates potential profits. It is important to notice that this is not the inverse of indicating a potential loss. An extremely low value for trendpot does not necessarily mean that the observed price move gives reason for a medium to long term trend following system to show a negative result. Although in many circumstances, such as the aforementioned trend reversals, this will be the case. In some others, it will not. To give a theoretical extreme example: in case a market does not move at all during a month, it is impossible for any system to be profitable, but also impossible for any system to be losing. In this scenario, the value of trendpot will be zero. In the above graph for FTSE, the price move in November '09 is somewhat like that.
The measure trendpot can explain profits. It can also explain a lack of profits. But it is not defined to explain losses.
Measure versus indicator
It is also important to notice that trendpot is a measure, not a trend indicator. Although both are calculated on past price moves, there is an essential difference:
- A trend indicator is designed to have a forward looking, predictive value.
- Trendpot is designed to have a backward looking, explaining value.
Transtrend does not use the measure trendpot, or any variation of it, for trading purposes. And we can and will not recommend anyone to do so. This statement is not only meant as a disclaimer; the measure simply does not have predictive value.
Trendpot is a measure, not a trend indicator. It does not have predictive value.
Trendpot therefore has the following implications:
- A high value for trendpot means that a medium to long term trend following system has a high chance of having been profitable during that specific month, if it would have been active in that market. It does not mean that a medium to long term trend following system should have been active in that market during that month.
- A low value for trendpot means that a medium to long term trend following system has a low chance of having been profitable during that specific month, if it would have been active in that market. It does not mean that a medium to long term trend following system should not have been active in that market during that month.
To give an example of the latter: anyone being invested with a medium to long term trend following CTA would expect this CTA to have been short Swap Notes coming into June '09 (see the first graph). But no one being invested with a medium to long term trend following CTA could expect this CTA to have made a profit in the Swap Notes during June '09.
Practical usage of trendpot
As emphasized before, trendpot has no predictive value. We do not think that we are able to predict when trendpot will be high or low, or in which markets trendpot will be high or low. For us, trendpot only has explanatory power. We can use it for evaluation purposes.
For instance, in evaluating disappointing performance one can easily step into the pitfall of focusing too much on the markets that delivered the biggest losses. But if these markets (looking backward) showed an extremely low trendpot, what performance could have been expected with a medium to long-term trend following system trading these markets? More can be learned from focusing on the trading system's behavior in the high potential markets where no profit was made. And likewise, from focusing on the low potential markets where the trading systems were profitable.
To conclude, it should be emphasized that we certainly do not want to constantly adjust our trading systems to last month's disappointments. The long term perspective shall never be flushed away by short term emotions!

- Source of price data used in all price graphs in this paper: Thomson Reuters, Bloomberg and Transtrend.